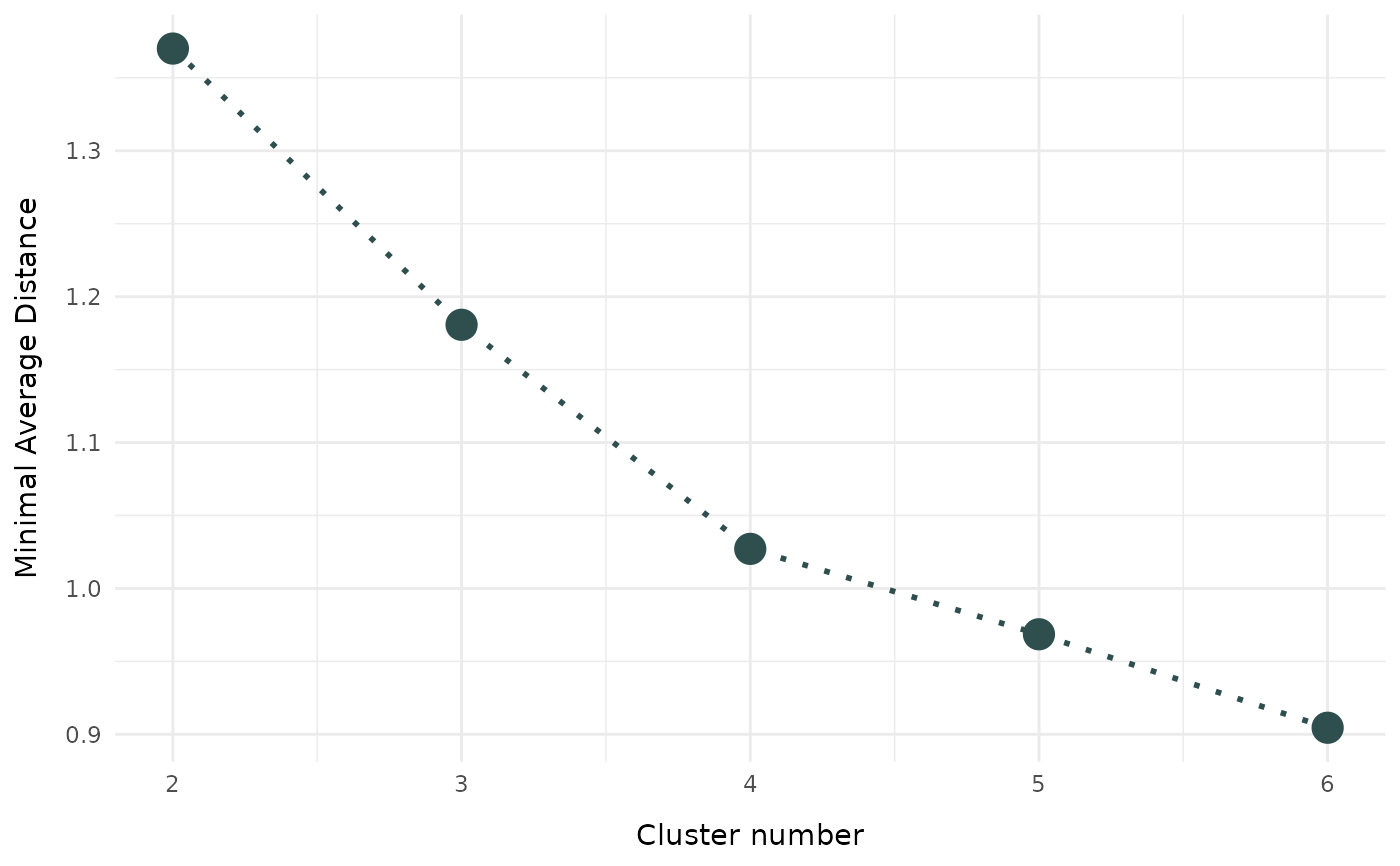
Visualization of the selection criterion for different cluster numbers
evaluate_cluster_numbers.RdFunction to provide graphical visualization for selecting the optimal number of clusters. The function performs clustering for a range of potential numbers of clusters. The optional graphical visualization shows the minimal (weighted) average distance for every cluster numbers. Detailed fuzzyclara clustering results can be returned with return_results = TRUE. For clara clustering, the same samples are used for all numbers of clusters.
Usage
evaluate_cluster_numbers(
  data,
  clusters_range = 2:5,
  metric = "euclidean",
  algorithm = "clara",
  samples = 10,
  sample_size = NULL,
  num_local = 5,
  max_neighbors = 100,
  type = "hard",
  cores = 1,
  seed = 1234,
  m = 1.5,
  scale = TRUE,
  build = FALSE,
  verbose = 1,
  plot = TRUE,
  return_results = FALSE,
  ...
)
Arguments
- data
data.frame to be clustered
- clusters_range
Evaluated range for the number of clusters. Defaults to
2:5.- metric
A character specifying a predefined dissimilarity metric (like
"euclidean"or"manhattan") or a self-defined dissimilarity function. Defaults to"euclidean". Will be passed as argumentmethodtodist, so check?proxy::distfor full details.- algorithm
One of
c("clara","clarans")- samples
Number of subsamples
- sample_size
Number of observations belonging to a sample. If NULL (default), the minimum of
nrow(data)and40 + clusters * 2is used as sample size.- num_local
Number of clustering iterations (only if
algorithm = "clarans").- max_neighbors
Maximum number of randomized medoid searches with each cluster (only if
algorithm = "clarans")- type
One of
c("hard","fuzzy"), specifying the type of clustering to be performed.- cores
Numbers of cores for computation.
cores > 1implies a parallel call. Defaults to 1.- seed
Random number seed. Defaults to 1234.
- m
Fuzziness exponent (only for
type = "fuzzy"), which has to be a numeric of minimum 1. Defaults to 2.- scale
Scale numeric variables before distance matrix calculation? Default TRUE
- build
Additional build algorithm to choose initial medoids (only relevant for type = "fuzzy". Default FALSE.)
- verbose
Can be set to integers between 0 and 2 to control the level of detail of the printed diagnostic messages. Higher numbers lead to more detailed messages. Defaults to 1.
- plot
Should a plot with minimum distances be returned? Defaults to TRUE.
- return_results
Indicator if clustering results ("fuzzyclara" objects) should be returned as a list. Defaults to FALSE.
- ...
Additional arguments passed to the main clustering algorithm call with
fuzzyclara.