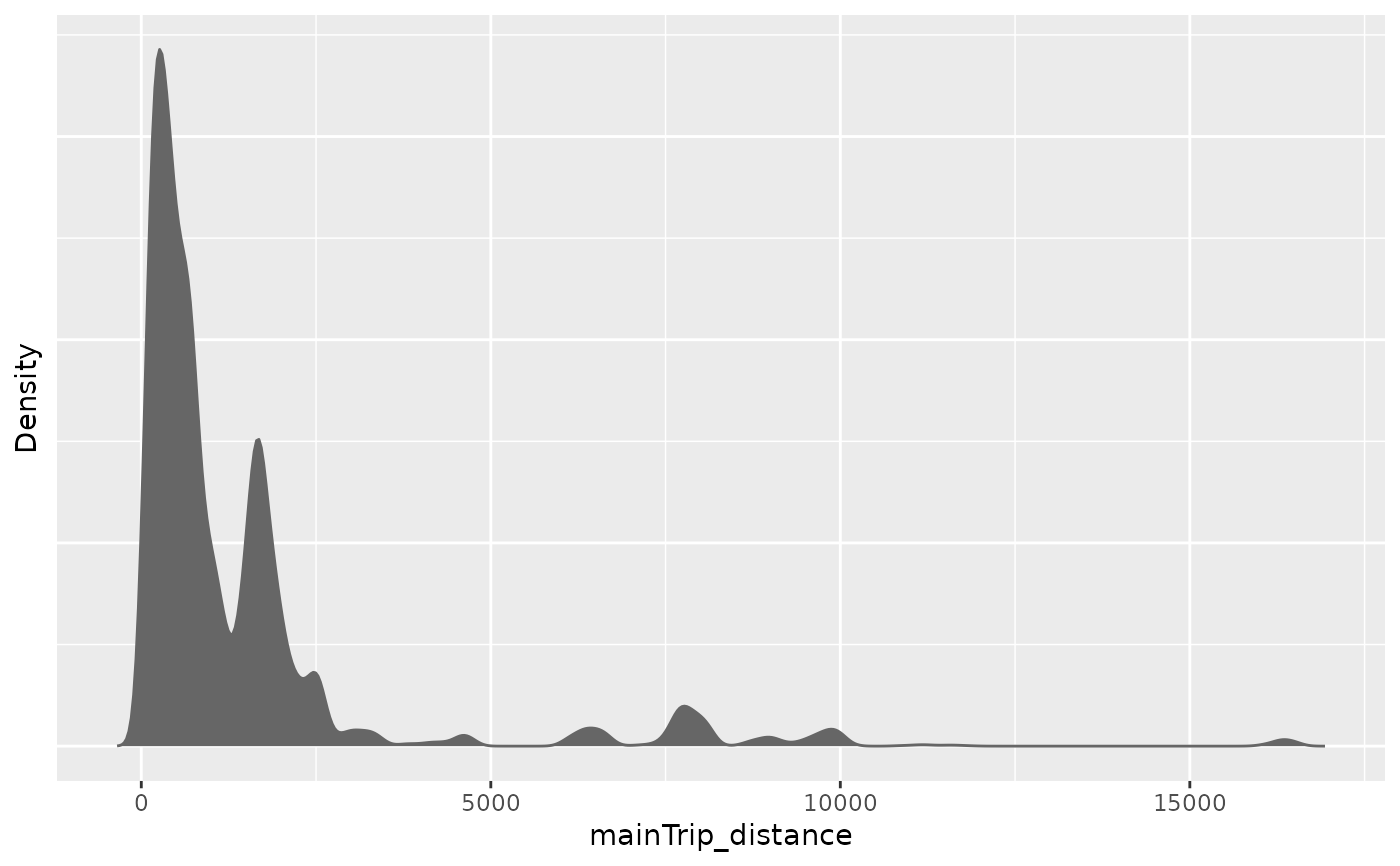
Create a density plot or a boxplot of one metric variable or a barplot of one categorical variable, based on a specific subset of the data.
Usage
plot_density(
  dat,
  y_var,
  plot_type = "density",
  apc_range = NULL,
  highlight_diagonals = NULL,
  y_var_cat_breaks = NULL,
  y_var_cat_labels = NULL,
  weights_var = NULL,
  log_scale = FALSE,
  xlab = NULL,
  ylab = NULL,
  legend_title = NULL,
  ...
)
Arguments
- dat
Dataset with columns
periodandageand the main variable specified through argumenty_var.- y_var
Character name of the main variable to be plotted.
- plot_type
One of
c("density","boxplot"). Only used if they_varcolumn is metric.- apc_range
Optional list with one or multiple elements with names
"age","period","cohort"to filter the data. Each element should contain a numeric vector of values for the respective variable that should be kept in the data. All other values are deleted.- highlight_diagonals
Optional internal parameter which is only specified when
plot_densityis called from withinplot_densityMatrix. Seeplot_densityMatrixfor details.- y_var_cat_breaks
Optional numeric vector of breaks to categorize
y_varbased on calling functioncut. Only used to highlight the categories based on different colors. And only used if they_varcolumn is numeric.- y_var_cat_labels
Optional character vector for the names of the categories that were defined based on
y_var_cat_breaks. The length of this vector must be one shorter thanlength(y_var_cat_breaks). Only used if they_varcolumn is numeric.- weights_var
Optional character name of a weights variable used to project the results in the sample to some population.
- log_scale
Indicator if the main variable should be log10 transformed. Only used if the
y_varcolumn is numeric. Defaults to FALSE.- xlab, ylab, legend_title
Optional plot annotations.
- ...
Additional arguments passed to
density.
Details
If plot_density is called internally from within
plot_densityMatrix (i.e., if the dataset contains some of the
columns c("age_group","period_group","cohort_group")), this function
will calculate the metric densities individually for these groups.
Author
Alexander Bauer alexander.bauer@stat.uni-muenchen.de, Maximilian Weigert maximilian.weigert@stat.uni-muenchen.de