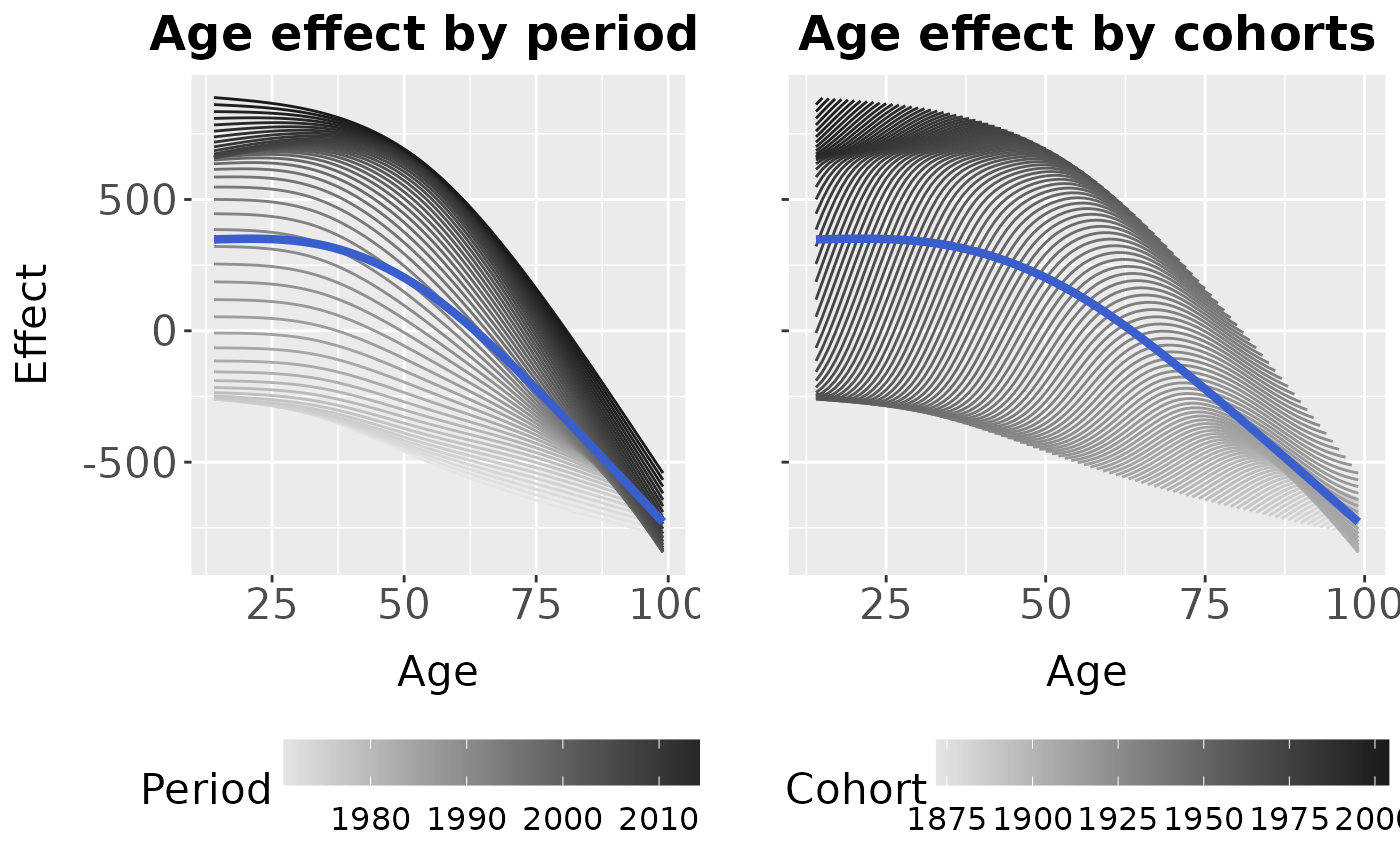
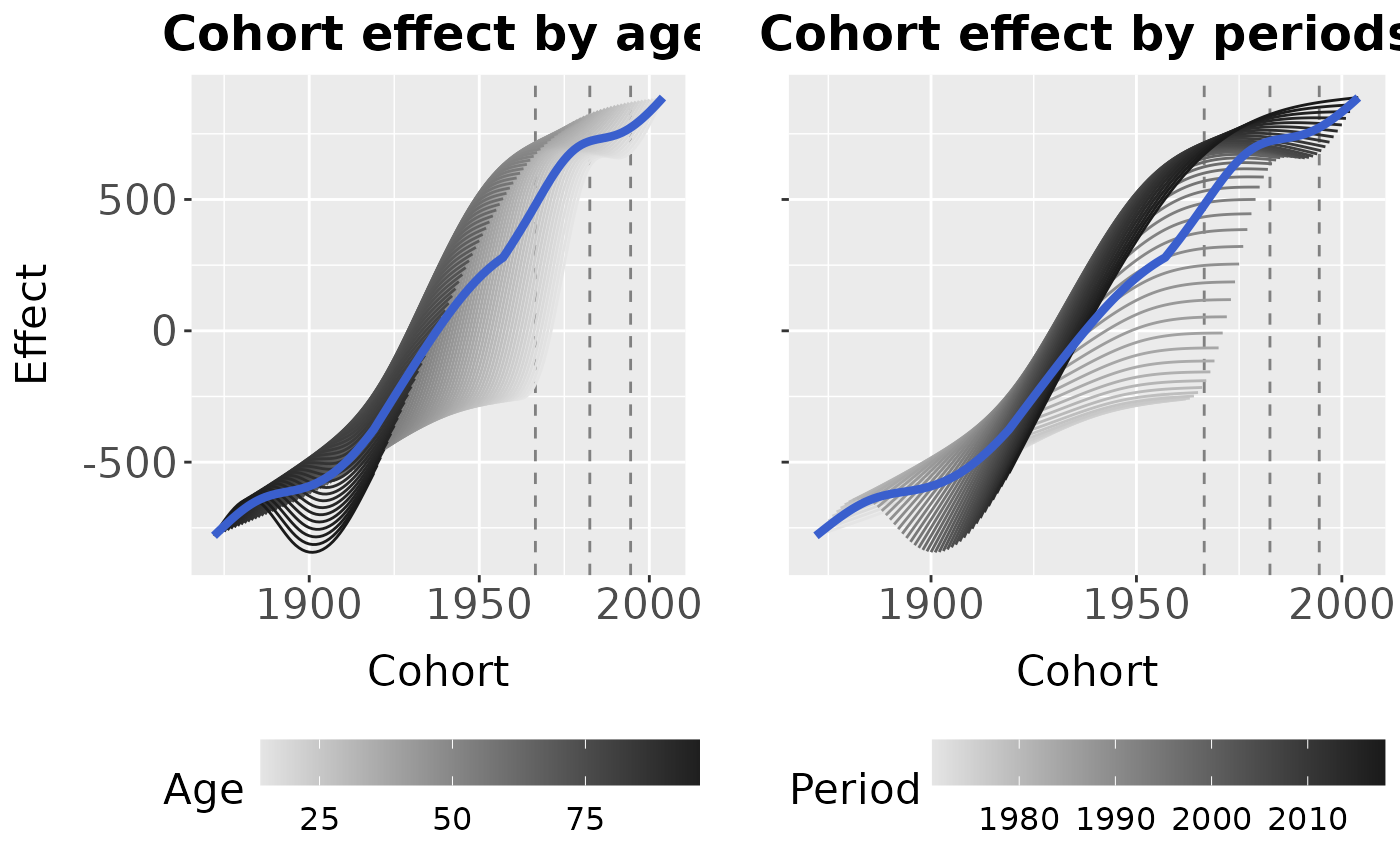
Partial APC plots based on an estimated GAM model
Source:R/plot_partialAPCeffects.R
plot_partialAPCeffects.RdCreate the partial APC plots based on an APC model estimated as a semiparametric
additive regression model with gam or bam.
Usage
plot_partialAPCeffects(
  model,
  dat,
  variable = "age",
  hide_partialEffects = FALSE,
  vlines_vec = NULL,
  plot_CI = FALSE,
  return_plotData = FALSE
)
Arguments
- model
Optional regression model estimated with
gamorbamto estimate a smoothed APC surface. Only used ify_varis not specified.- dat
Dataset with columns
periodandage. Ify_varis specified, the dataset must contain the respective column. Ifmodelis specified, the dataset must have been used for model estimation withgamorbam.- variable
One of
c("age","period","cohort"), specifying the temporal dimension for which the partial effect plots should be created.- hide_partialEffects
If TRUE, only the marginal effect will be plotted. Defaults to FALSE.
- vlines_vec
Optional numeric vector of values on the x-axis where vertical lines should be drawn. Can be used to highlight the borders of specific age groups, time intervals or cohorts.
- plot_CI
Indicator if 95% confidence intervals for marginal APC effects should be plotted. Only used if
hide_partialEffectsis set to TRUE. Defaults to FALSE.- return_plotData
If TRUE, a list of the datasets prepared for plotting is returned instead of the ggplot object. The list contains one dataset each for the overall effect (= evaluations of the APC surface to plot the partial effects) and for each marginal APC effect (no matter the specified value of the argument
variable). Defaults to FALSE.
Value
ggplot object (if hide_partialEffects is TRUE) or a plot grid
created with ggarrange (if FALSE).
Details
If the model was estimated with a log or logit link, the function automatically performs an exponential transformation of the effect.
References
Weigert, M., Bauer, A., Gernert, J., Karl, M., Nalmpatian, A., Küchenhoff, H., and Schmude, J. (2021). Semiparametric APC analysis of destination choice patterns: Using generalized additive models to quantify the impact of age, period, and cohort on travel distances. Tourism Economics. doi:10.1177/1354816620987198.
Author
Alexander Bauer alexander.bauer@stat.uni-muenchen.de, Maximilian Weigert maximilian.weigert@stat.uni-muenchen.de