Usage
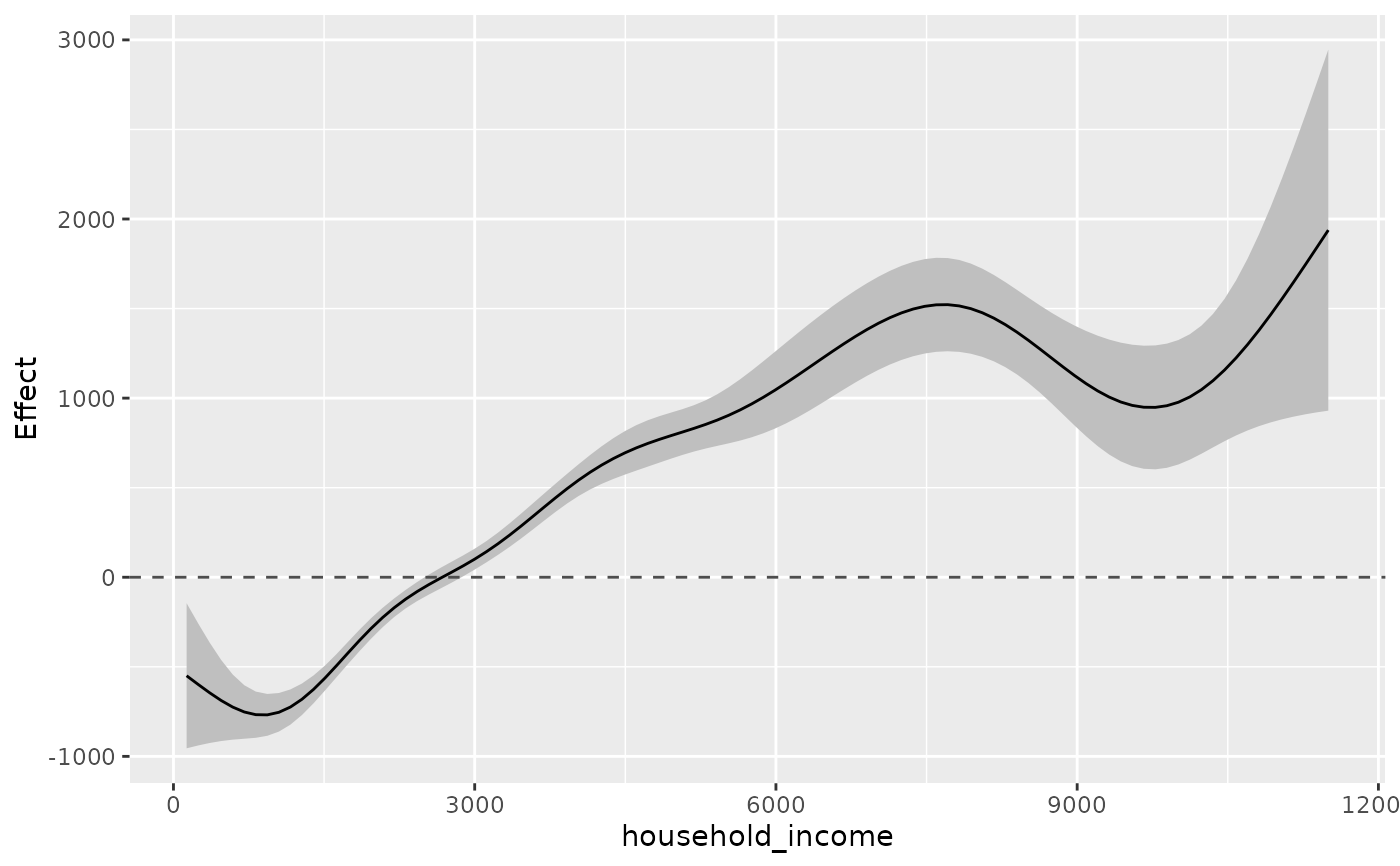
plot_1Dsmooth(
  model,
  plot_ci = TRUE,
  select,
  alpha = 0.05,
  ylim = NULL,
  method_expTransform = "simple",
  return_plotData = FALSE
)
Arguments
- model
- plot_ci
If
TRUECIs are plotted. Only used ifplot_type = 1.- select
Index of smooth term to be plotted.
- alpha
(1-alpha)CIs are calculated. The default 0.05 leads to 95% CIs.- ylim
Optional limits of the y-axis.
- method_expTransform
One of
c("simple","delta"), stating if standard errors and confidence interval limits should be transformed by a simple exp transformation or using the delta method. The delta method can be unstable in situations and lead to negative confidence interval limits. Only used when the model was estimated with a log or logit link.- return_plotData
If TRUE, the dataset prepared for plotting is returned. Defaults to FALSE.
Details
If the model was estimated with a log or logit link, the function
automatically performs an exponential transformation of the effect,
see argument method_expTransform.
Author
Alexander Bauer alexander.bauer@stat.uni-muenchen.de
